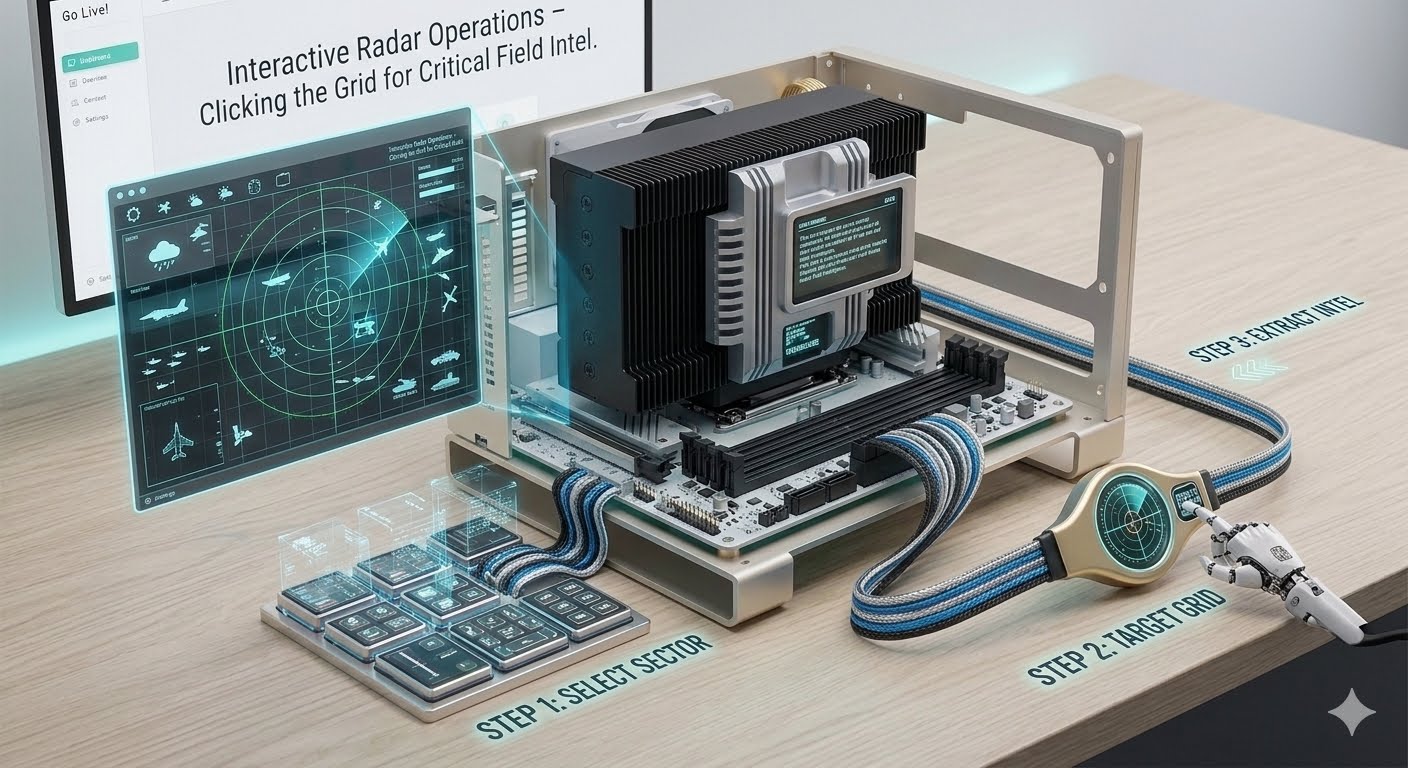
- The Visual Framework: Staring at lines of raw spreadsheet data or long paragraphs during an escalating crisis makes it incredibly difficult to grasp a situation quickly. Project Sit-Rep uses an interactive, military-green geospatial grid layout to visualize threats instantly.
- Pixel Collision Tracking: The center stage of your dashboard features an independent HTML5 Canvas map viewer. The background script translates geographic latitudes and longitudes directly into interactive canvas coordinates. The framework tracks every target point using strict pixel boundaries.
- How to Operate It: When an active danger icon illuminates on your map grid (such as a critical seismic event or a livestock quarantine vector), simply move your cursor over the indicator ring and click it. The interface maps the pixel collision and opens an instant, dedicated operational briefing pop-up detailing the exact severity, coordinates, and response guidelines for that specific alert zone.
Interactive Radar Operations – Clicking the Grid for Critical Field Intel